The Missing Kingdom: Why Fungi Must Be Central to Conservation Strategy
28 December 2025
Published online 16 October 2019
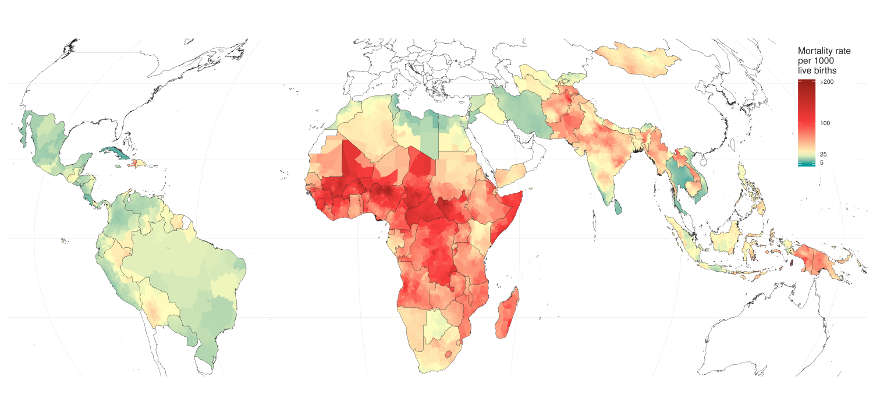
Detailed maps show progress and difficulties of newborn and child survival within and across countries.
Institute for Health Metrics and Evaluation
Enlarge image
A large international team led by researchers at the University of Washington, in the United States, has produced high-resolution maps from estimates of death counts and mortality rates of children under five, between 2000 and 2017. The maps were build from models based on 16 million records from 467 surveys and censuses, and provide an unprecedented level of detail for 99 low- and middle-income countries, where the risk of dying before the fifth birthday is the highest.
Despite remarkable progress, a shift emerged in most regions: neonate and infant mortality rose relative to the mortality of children between one and four years old. “Preterm birth is the leading cause of child deaths worldwide, but most of these deaths are eminently preventable,” says epidemiologist, Joy Lawn of the London School of Hygiene & Tropical Medicine, who was not involved in the study. “With only a decade left to reach the SDG target, data must link to action, or the poorest families will continue to be left behind.”
Among the 99 countries included, India, Nigeria, Pakistan, and the Democratic Republic of the Congo witnessed the largest number of premature deaths in 2017. The Central African Republic had the highest mortality rate, while Cuba had the lowest. Beyond these country-level variations, the study also points out to the disparities among different districts of the same country. The researchers estimated that more than 70 million child deaths, almost 60% of the total, can be traced back to subnational inequalities.
The Middle East followed a similar overall trend. “In 2017, the Middle East included some of the best performing countries, such as Iran and Jordan, as well as some of the highest child mortality rates outside sub-Saharan Africa, namely Afghanistan and Pakistan,” explains epidemiologist Simon I. Hay of the University of Washington. “This variation becomes even more pronounced at the district level: ranging from around 11 deaths per 1,000 live births in Iran’s Abbasabad county, to approximately 121 in Kamdesh district in northeastern Afghanistan.”
doi:10.1038/nmiddleeast.2019.138
Burstein, R. et al. Mapping 123 million neonatal, infant and child deaths between 2000 and 2017. Nature 574, 353–358 (2019).
28 December 2025
24 December 2025
24 December 2025
20 June 2019
28 February 2018
07 September 2014
Sign-up to receive our e-alert update every two weeks to keep up with everything new on the portal.
Sign up for e-alerts
Stay connected: